
HOMER
Software for motif discovery and ChIP-Seq analysis
ChIP-Seq Analysis: Visualizing Experiments with the UCSC
Genome Browser
NOTE:
Recent upgrades by the UCSC Genome Browser may cause files made with
HOMER v2.3 or earlier to produce errors. HOMER v2.4 fixes this.The UCSC Genome Browser is quite possibly one of the best computational tools ever developed. Not only does it contain an incredible amount of data in a single application, it allows users to upload custom information such as data from their ChIP-Seq experiments so that they can be easily visualized.
The basic strategy HOMER uses is to create a bedGraph formatted file that can then be uploaded as a custom track to the genome browser. This is accomplished using the makeUCSCfile program. To make a ucsc visualization file, type the following:
makeUCSCfile
<tag
directory>
-o
auto
i.e. makeUCSCfile PU.1-ChIP-Seq/ -o auto
(output file will be in the PU.1-ChIP-Seq/ folder named PU.1-ChIP-Seq.ucsc.bedGraph.gz)
The "-o auto" with make the program automatically generate an output
file name (i.e. TagDirectory.ucsc.bedGraph.gz) and place it in the tag
directory which helps with the organization of all these files.
The output file can be named differently by specifying "-o
outputfilename" or by simply omitting "-o", which will send the output
of the program to stdout
(i.e. add " > outputfile" to capture it in the file
outputfile). It is recommended that you zip the file using gzip and directly upload the zipped file when loading custom
tracks at UCSC.i.e. makeUCSCfile PU.1-ChIP-Seq/ -o auto
(output file will be in the PU.1-ChIP-Seq/ folder named PU.1-ChIP-Seq.ucsc.bedGraph.gz)
To visualize the ChIP-Seq experiment in the UCSC Genome Browser, go to Genome Browser page and select the appropriate genome (i.e. the genome that the sequencing tags were mapped to). Then click on the "add custom tracks" button (this will read "manage custom tracks" once at least one custom track is loaded). Enter the file created earlier in the "Paste URLs or data" section and click "Submit".
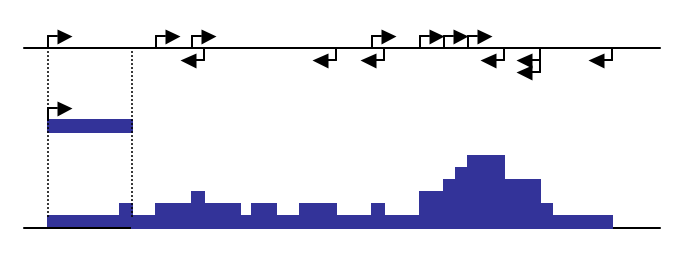
What does makeUCSCfile do?
The program works by
approximating the ChIP-fragment density at each position in the
genome. This is done by starting with each tag and extending it
by the estimated fragment length (determined by tag
auto correlation, or it can be manually specified using
"-fragLength
<#>"). The ChIP-fragment density is then defined as the
total number of overlapping fragments at each position in the
genome. Below is a diagram that depicts how this works:
As great as the UCSC Genome Browser is, the large size of recent ChIP-Seq experiments results in custom track files that are very large. In addition to taking a long time to upload, the genome browser has trouble loading excessively large files. To help cope with this, the makeUCSCfile program works by specifying a target file size when zipped (default 50MB). In order to meet the specified target file size, makeUCSCfile merges adjacent regions of tag density levels by their weighted average to reduce the total number lines in the final bedGraph file. If you have trouble loading getting your file to load, try reducing the size of the file using the "-fsize <#>" option (i.e. "-fsize 2e7"). To force the creation of larger files, use a very large file size (i.e. "-fsize 1e50") - this will create a file that does not merge any regions and displays a "native" view of the data.
Tags can be visualized separately for each strand using the "-strand separate" option.
Changing the Resolution
In
an
effort
to
reduce
the
size
of large UCSC files, one attractive option
is to reduce the overall resolution of the file. By default, makeUCSCfile will make full
resolution (i.e. 1 bp) files, but this can be changed by
specifying the "-res <#>"
option. For example, "-res 10"
will cause changes in ChIP-fragment density to be reported only every
10 bp.
Normalization of UCSC files
In order to easily compare
ChIP-fragment densities between different experiments, makeUCSCfile will normalize density
profiles based on the total number of mapped tags for each
experiment. As with other programs apart of HOMER, the total
number of tags is normalized to 10 million. This means that tags
from an experiment with only 5 million mapped tags will count for 2
tags apiece. The total of tags to normalize to can be changed
using the "-norm <#>" option.
Separating data from different strand (i.e. good for RNA-Seq
data)
You can specify that HOMER
separates the data based on the strand by using the "-strand
<...>" option. The following options are available:
"-strand both" : default behavior
for ChIP-Seq
"-strand separate" : separate data by strand
"-strand +" : only show the positive strand (i.e. watson strand) data
"-strand -" : only show the negative strand (i.e. crick strand) data
"-strand separate" : separate data by strand
"-strand +" : only show the positive strand (i.e. watson strand) data
"-strand -" : only show the negative strand (i.e. crick strand) data
Creating bigWig files with HOMER
Some data sets of very large, but
you still want to see all of the details from your sequencing in the
UCSC Genome Browser. HOMER can also produce bigWig files
by running the conversion program for you (bedGraphToBigWig). The only
catch is that you
must
have
access
to a webserver where you can post the resulting
bigWig file - this is because instead of uploading the whole file to
UCSC, the browser actually looks for the data file on YOUR webserver
and grabs only the parts it needs. Slick, eh. Chuck uses
this all the time for big experiments.
To use this feature, you must download the bedGraphToBigWig program from UCSC and place it somewhere in your executable path (i.e. the /path-to-homer/bin/ folder). To make a bigWig, add the "-bigWig -fsize 1e20" parameters to your makeUCSCfile command. When making a bigWig, you usually want to see all of the tag information, so make sure the "-fsize" options is large. You also need to specify an output file using "-o <bigwigfilename>" and also capture the stdout stream using "> trackfileoutput.txt". You can also use "-o auto". The "trackfileoutput.txt" will contain the header information that is uploaded as a costum track to UCSC.
After running the makeUCSCfile program with the bigWig options, you need to do the following:
- Copy the *.bigWig file to your webserver location and make sure it is viewable over the internet.
- Need to edit the "trackfileoutput.txt" file and enter the URL of your bigWig file (... bigDataUrl=http://server/path/bigWigFilename ...)
- Upload the "trackfileoutput.txt" file to UCSC as a costum
track to view your data.
makeUCSCfile
<tag
directory>
-o
auto
-bigWig
-fsize
1e20 > trackInfo.txt
i.e.
i.e.
makeUCSCfile
PU.1-ChIP-Seq/
-o
auto
-bigWig
-fsize 1e20 > PU.1-bigWig.trackInfo.txt
cp PU.1-ChIP-Seq/PU.1-ChIP-Seq.ucsc.bigWig /Web/Server/Root/Path/
** edit PU.1-bigWig.trackInfo.txt to have the right URL **
cp PU.1-ChIP-Seq/PU.1-ChIP-Seq.ucsc.bigWig /Web/Server/Root/Path/
** edit PU.1-bigWig.trackInfo.txt to have the right URL **
NOTE: As of now, a bigWig file
can only be composed of a single track - if you want to separate the
data by strands, do the following:
makeUCSCfile
PU.1-ChIP-Seq/
-o
PU.1.positiveStrand.bigWig -bigWig -fsize 1e20 -strand + >
PU.1-bigWig.trackInfo.positiveStrand.txt
makeUCSCfile PU.1-ChIP-Seq/ -o PU.1.negativeStrand.bigWig -bigWig -fsize 1e20 -strand - > PU.1-bigWig.trackInfo.negativeStrand.txt
cp PU.1.positiveStrand.bigWig PU.1.negativeStrand.bigWig /Web/Server/Root/Path/
cat PU.1-bigWig.trackInfo.positiveStrand.txt PU.1-bigWig.trackInfo.negativeStrand.txt > PU.1-bigWig.trackInfo.both.txt
** edit PU.1-bigWig.trackInfo.both.txt to have the right URLs for both the negative and positive strands **
Examples of UCSC bedGraph files
The following shows what the same
data set looks like changing options for file size (-fsize) and
resolution (-res). Usually it's best to use one or the other.
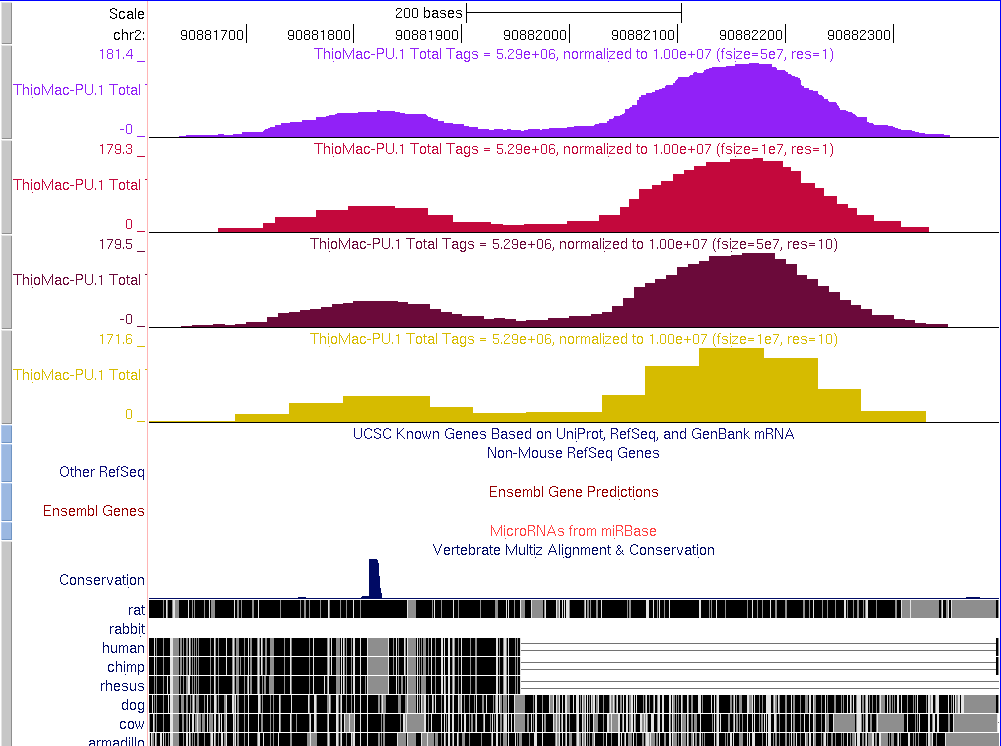
- -fsize 5e7 -res 1
- -fsize 1e7 -res 1
- -fsize 5e7 -res 10
- -fsize 1e7 -res 10
Command line options for makeUCSCfile
Usage: makeUCSCfile <tag directory> [options]
Creates a bedgraph file for visualization using the UCSC Genome Browser
General Options:
-fsize <#> (Size of file, when gzipped, default: 5e7)
-strand <both|separate> (control if reads are separated by strand, default: both)
-fragLength <#|auto> (Approximate fragment length, default: auto)
-res <#> (Resolution, in bp, of file, default: 1)
-norm <#> (Total number of tags to normalize experiment to, default: 1e7)
-color <(0-255),(0-255),(0-255)> (no spaces, rgb color for UCSC track, default: random)
-bigWig (creates a full resolution bigWig file and track line file)
This requires bedGraphToBigWig to be available
-o <filename|auto> (send output to this file - will be gzipped, default: prints to stdout)
auto: this will place an appropriately named file in the tag directory
Next: Finding Peaks (ChIP-enriched
regions) in the genome

Can't figure something out? Questions, comments, concerns, or other feedback:
cbenner@ucsd.edu