
HOMER
Software for motif discovery and ChIP-Seq analysis
ChIP-Seq Analysis: Finding Peaks (ChIP-enriched Regions)
Finding peaks is one of the central goals of any ChIP-Seq
experiment. The basic idea is to identify regions in the genome
where we find more ChIP-Seq tags than we would expect to see by
chance. There are number of different approaches one can use to
find ChIP-Seq peaks, and correspondingly there are many different
methods for identifying peaks from ChIP-Seq experiments. It is
not required that you use HOMER for peak finding to use the rest of the
tools included in HOMER (see
below).The most important distinction between HOMER and several other peak finding algorithms is that by default HOMER searches for peaks of FIXED SIZE. This is ideal for achieving maximum sensitivity when finding peaks for Transcription Factors or other proteins that make contact at a single point along the DNA. Peaks at these locations should contain nearly identical tag distributions (i.e. since ChIP-fragments are only ~150 bp, binding to a specific site should not (in principle) produce peaks wider than the fragment length in either direction).
The default settings in HOMER is not particularly good at identifying "enriched blocks" which are typical of repressive histone modifications such as H3K9me3 and H3K27me3. HOMER will find regions that are enriched regardless of shape and size, but if your research requires that you accurately identify the boundaries of large enrichment blocks of varying size, try using the option "-region". (See Finding Regions of Variable Length) Histone marks that are more "focal", such as H3K4me1, H3K4me2, H3K4me3 or H3/H4 acetylation are easily found with HOMER when using a larger peak size (i.e. -size 1000)
The other reason HOMER uses fixed size peaks is that the assumptions needed for Motif Finding are, let's say, less violated, when dealing with regions of constant size.
Finding Transcription Factor Peaks with HOMER
To find peaks for a transcription
factor use the findPeaks
command:
findPeaks
<tag
directory>
-center
-o
<output
peak
file>
i.e. findPeaks ERalpha-ChIP-Seq/ -center -o ERalpha.peaks.txt
i.e. findPeaks ERalpha-ChIP-Seq/ -center -o ERalpha.peaks.txt
Where the first argument must be
the tag directory (required). The "-center" option ensures the the peak
is place on the region of maximum ChIP-fragment density, and is
recommended when analyzing ChIP-Seq for transcription factors. It
is highly recommended that you develop a strategy for keeping track of
these files. For example, it's usually nice to place peak files
in the tag directory they are associated with so that they are easy to
find later. For example:
Homer attempts to automatically determine parameters needed for peak finding - most importantly the size of the peak and the length of ChIP-fragments (determined from the tag auto correlation, stored as parameters in the <tag directory>/tagInfo.txt file). These can be overwritten using the "-size <#>" and "-fragLength <#>" options. You can also set the minimum distance between peaks using "-minDist <#>" (default is 2.5x the peak size). Strand specific peak finding is also available ("-strand separate").
Be default, HOMER assumes an effective genome size of 2 billion (fine for human or mouse). This can be explicitly set using the "-gsize <#>" option. HOMER determines the threshold of tags needed to call a peak significant by assuming that non-enriched ChIP-fragment concentrations are approximated by the Poisson distribution, which is similar to just about every other method out there. The cutoff for statistically significant peaks can be specified by "-fdr <#>" or with "-poisson <#>".
findPeaks ERalpha-ChIP-Seq/
-center -o ERalpha-ChIP-Seq/peaks.txt
Homer attempts to automatically determine parameters needed for peak finding - most importantly the size of the peak and the length of ChIP-fragments (determined from the tag auto correlation, stored as parameters in the <tag directory>/tagInfo.txt file). These can be overwritten using the "-size <#>" and "-fragLength <#>" options. You can also set the minimum distance between peaks using "-minDist <#>" (default is 2.5x the peak size). Strand specific peak finding is also available ("-strand separate").
Be default, HOMER assumes an effective genome size of 2 billion (fine for human or mouse). This can be explicitly set using the "-gsize <#>" option. HOMER determines the threshold of tags needed to call a peak significant by assuming that non-enriched ChIP-fragment concentrations are approximated by the Poisson distribution, which is similar to just about every other method out there. The cutoff for statistically significant peaks can be specified by "-fdr <#>" or with "-poisson <#>".
Output: the Peak file
HOMER outputs peak information in
the form of an text file which is easily opened with EXCEL. A
typical peak file will look something like this:
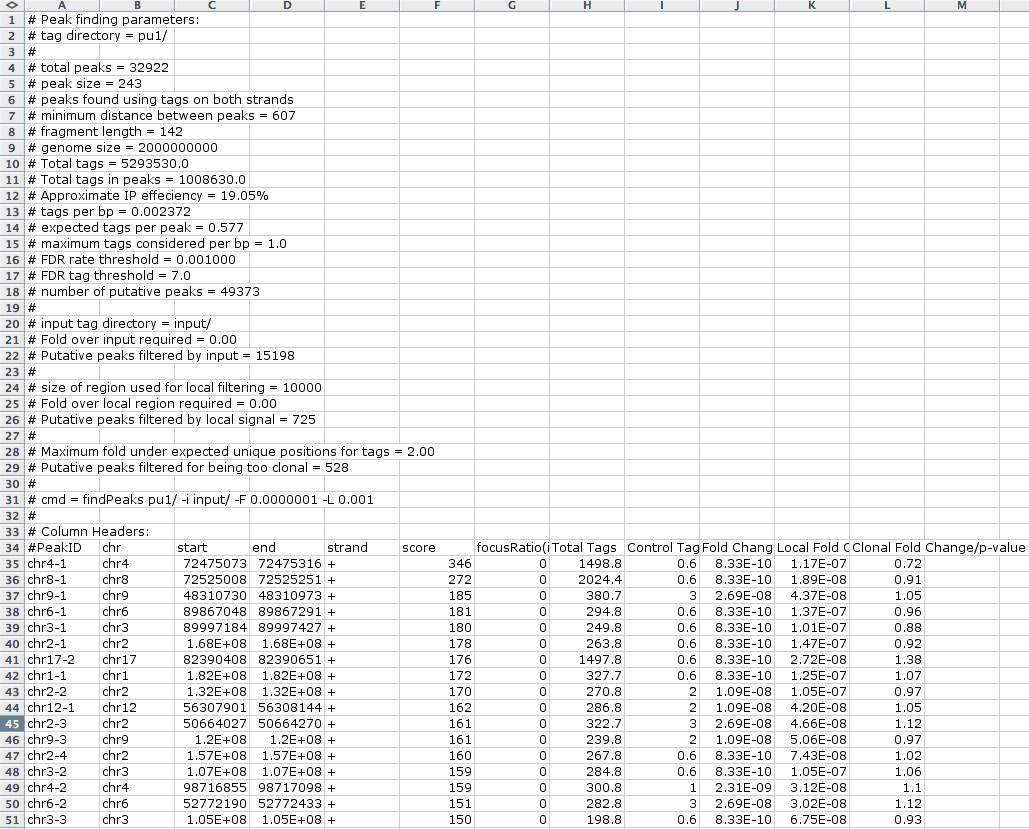
The first several rows start with a "#", which contains meta information about the peak finding procedure. Below this information are the peaks, listed in each row. Columns contain information about each peak:
The first several rows start with a "#", which contains meta information about the peak finding procedure. Below this information are the peaks, listed in each row. Columns contain information about each peak:
- Column 1: PeakID - a unique name for each peak (very important that peaks have unique names...)
- Column 2: chr - chromosome where peak is located
- Column 3: starting position of peak
- Column 4: ending position of peak
- Column 5: Strand (+/-)
- Column 6: Score - number of tags found clustered together (may differ from total tag count depending on how many tags were considered per bp)
- Column 7: Focus Ratio - fraction of tags found appropriately upstream and downstream of the peak center. Describes the chances that factor binds a single spot on the DNA. (will be set to zero if -center was NOT used)
- Columns 8+: Statistics and Data from filtering
Two generic tools are available
as part of HOMER to convert peak files to BED files and back.
This will allow you to upload your peak files to the UCSC Genome
Browser, or convert peak files in BED format from another program into
a peak file that can be used by HOMER. These programs are named pos2bed.pl and bed2pos.pl, which can be used the
following way:
pos2bed.pl
peakfile.txt
>
peakfile.bed
bed2pos.pl peakfile.bed > peakfile.txt
bed2pos.pl peakfile.bed > peakfile.txt
How findPeaks works
findPeaks
initially works by analyzing tag positions as opposed to ChIP-fragment
densities. This is partially done to keep the program flexible
for various tasks. In order to analyze ChIP-Seq data for peaks,
the first step is to "adjust" the positions of tags to the center of
their ChIP-fragments so that tag densities can be more accurately
calculated. This tag position adjustment is half of the
estimated ChIP-fragment length in the 3' direction relative to the
original position of the tag.
The program then sorts tags along each chromosome and efficiently looks at each tag position to calculate the number tags found within the designated peak size. It then sorts tag positions from those with the highest density of tags through those with the lowest, assigning putative peaks and masking nearby positions within the minimum distance acceptable for neighboring peaks (-minDist). Positions that are masked essentially represent positions near a better candidate peak, and as the program encounters masked positions, it further masked positions near positions that were already masked to ensure peaks identified come from local maxima. After cycling through all tag positions, a putative list of peaks is generated representing local maximum in tag distributions. These are subjected to additional filters based on input sequencing, etc.
The program then sorts tags along each chromosome and efficiently looks at each tag position to calculate the number tags found within the designated peak size. It then sorts tag positions from those with the highest density of tags through those with the lowest, assigning putative peaks and masking nearby positions within the minimum distance acceptable for neighboring peaks (-minDist). Positions that are masked essentially represent positions near a better candidate peak, and as the program encounters masked positions, it further masked positions near positions that were already masked to ensure peaks identified come from local maxima. After cycling through all tag positions, a putative list of peaks is generated representing local maximum in tag distributions. These are subjected to additional filters based on input sequencing, etc.
Filtering Peaks
The initial step of peak finding
is to find non-random clusters of tags, but in many cases these
clusters may not be representative of try transcription factor binding
events. To increase the overall quality of peaks identified by
HOMER, 3 separate filtering steps can be applied to the initial peaks
identified:
Filtering Based on Clonal Signal
Disabling Filtering
Using Input/IgG Sequencing as a Control
To use an Input or IgG sequencing
run as a control (HIGHLY
RECOMMENDED), you must first create a separate tag directory for
the input experiment (see here).
Additionally, you can use other cleaver experiments as a control, such
as a ChIP-Seq experiment for the same factor in another cell or in a
knockout. To find peaks using a control, type:
HOMER offers two ways to filter peaks against a control experiment. First, if you prefer a simple fold change, HOMER will require that each putative peak be greater than 4-fold (or specify with "-F <#>"). In the case where there are no input tags near the putative peak, HOMER automatically sets these regions to be set to the average input tag coverage to avoid dividing by zero. Alternatively, HOMER can adhere to more statistically rigorous measures of differential tag enrichment by using the poisson distribution to model peak similarity. To filter peaks based on their poisson p-value, use "-F <#>" but enter a number between 0 and 1 (i.e. "-F 0.0001").
findPeaks
<tag
directory>
-center
-i
<control
tag
directory>
-o
<output
peak
file>
i.e. findPeaks ERalpha-ChIP-Seq/
-i Input-ChIP-Seq/ -center -o ERalpha.peaks.txt
HOMER offers two ways to filter peaks against a control experiment. First, if you prefer a simple fold change, HOMER will require that each putative peak be greater than 4-fold (or specify with "-F <#>"). In the case where there are no input tags near the putative peak, HOMER automatically sets these regions to be set to the average input tag coverage to avoid dividing by zero. Alternatively, HOMER can adhere to more statistically rigorous measures of differential tag enrichment by using the poisson distribution to model peak similarity. To filter peaks based on their poisson p-value, use "-F <#>" but enter a number between 0 and 1 (i.e. "-F 0.0001").
Filtering Based on Local Signal
Our experience with peak finding
is that often putative peaks are identified in regions of genomic
duplication, or in regions where the reference genome likely differs
from that of the genome being sequenced. This produces large
regions of high tag counts, and if no Input/IgG sample is available, it
can be hard to exclude these regions. Also, it may be
advantageous to remove putative peaks that a spread out over larger
regions as it may be difficult to pin-point the important regulatory
regions within them.
To deal with this, HOMER will filter peaks based on the local tag counts (similar in principle to MACS). Be default, HOMER requires the tag density at peaks to be 4-fold greater than in the surrounding 10 kb region. This can be modified using "-L <#>" and "-localSize <#>" to change the fold threshold and size of the local region, respectively. Alternatively, a poisson p-value threshold can be set using "-L <#>" between 0 and 1.
To deal with this, HOMER will filter peaks based on the local tag counts (similar in principle to MACS). Be default, HOMER requires the tag density at peaks to be 4-fold greater than in the surrounding 10 kb region. This can be modified using "-L <#>" and "-localSize <#>" to change the fold threshold and size of the local region, respectively. Alternatively, a poisson p-value threshold can be set using "-L <#>" between 0 and 1.
Filtering Based on Clonal Signal
When we first sifted through
peaks identified in ChIP-Seq experiments we noticed there are many
peaks near repeat elements that contain odd tag distributions.
These appear to arise from expanded repeats that result in peaks with
high numbers of tags from only a small number of unique positions, even
when many of the other positions withing the region may be
"mappable". To help remove these peaks, HOMER will compare the
number of unique positions containing tags in a peak relative to the
expected number of unique positions given the total number of tags in
the peak. If the ratio between the later and the former number
gets to high, the peak is discarded. The fold threshold can be
set with the "-C <#>" option (default: "-C 2"). Homer uses
the averageTagsPerPosition
parameter in the tagInfo.txt file
adjust
this
calculation
as
to
not
over-penalize
ChIP-Seq
experiments
that
are already highly "clonal". If
analyzing MNase or other restriction enzyme digestion experiments turn
this option off ("-C 0");
Disabling Filtering
To disable Input, Local, or
Clonal filtering set any combination of "-F 0 -L 0 -C 0".
Finding Peaks of fixed length using Histone Modification Data.
Finding peaks using histone
modification data can be a little tricky - largely because we have very
little idea what the histone marks actually do. If you want to
find peaks in histone modification data with the purpose of analyzing
them for enriched motifs, read this section. If you are trying to
annotate regions of the genome that are covered by a given mark, read
the next section. The problem with histone modification data (and
some other types) is that the signal can spread over large
distances. Trying to analyze large, variable length regions for
motif enrichment is very difficult and not recommended.
There are two important differences between finding fixed width peaks for transcription factors and histone modifications. The first is the size of the peaks: Most histone modifications should be analyzed using a peak size in the range of 500-2000 usually (i.e. "-size 1000"). The other is that you should omit the "-center" option. Since you are looking at a region, you do not necessarily want to center the peak on the specific position with the highest tag density, which may be at the edge of the region. Besides, in the case of histone modifications at enhancers, the highest signal will usually be found on nucleosomes surrounding the center of the enhancer, which is where the functional sequences and transcription factor binding sites reside. Typically, adding the -center option moves peaks further away from the functional sequence in these scenarios. An example for finding peaks:
One issue with finding histone modification peaks using the defaults in HOMER is that the Local filtering step removes several of the peaks due to the "spreading" nature of many histone modifications. This can be good and bad. If you are looking for nice concentrated regions of modified histones, the resulting peaks will be a nice set for further analysis such as motif finding. However, if you are looking to identify every region in the cell that has an appreciable amount of modified histone, you may want to disable local filtering, or consider using the "-region" option below e.g.:
There are two important differences between finding fixed width peaks for transcription factors and histone modifications. The first is the size of the peaks: Most histone modifications should be analyzed using a peak size in the range of 500-2000 usually (i.e. "-size 1000"). The other is that you should omit the "-center" option. Since you are looking at a region, you do not necessarily want to center the peak on the specific position with the highest tag density, which may be at the edge of the region. Besides, in the case of histone modifications at enhancers, the highest signal will usually be found on nucleosomes surrounding the center of the enhancer, which is where the functional sequences and transcription factor binding sites reside. Typically, adding the -center option moves peaks further away from the functional sequence in these scenarios. An example for finding peaks:
findPeaks H3K4me1-ChIP-Seq/ -i
Input-ChIP-Seq -size 1000 -o H3K4me1-ChIP-Seq/peaks.1kb.txt
One issue with finding histone modification peaks using the defaults in HOMER is that the Local filtering step removes several of the peaks due to the "spreading" nature of many histone modifications. This can be good and bad. If you are looking for nice concentrated regions of modified histones, the resulting peaks will be a nice set for further analysis such as motif finding. However, if you are looking to identify every region in the cell that has an appreciable amount of modified histone, you may want to disable local filtering, or consider using the "-region" option below e.g.:
findPeaks H3K4me1-ChIP-Seq/ -i
Input-ChIP-Seq -size 1000 -L
0 -o H3K4me1-ChIP-Seq/peaks.1kb.txt
Also, if using MNase-treated
chromatin (i.e. nucleosome mapping), you may want to use "-C 0" to
avoid filtering peaks composed of highly clonal tag positions.
These can arise from well positioned nucleosomes (or sites that are
nicely digested by MNase)
Finding Enriched Regions of
Variable Length
If the option "-region" is specified, findPeaks will stitch together
enriched peaks into regions. Note that local filtering is turned
off when finding regions. The most important parameters for
region finding are the "-size"
and "-minDist" (and of course
the fragment length). First of all, "-size" specifies the width of peaks
that will form the basic building blocks for extending peaks into
regions. Smaller peak sizes offer better resolution, but
larger peak sizes are usually more sensitive. By default findPeaks uses the estimated peak
size from the autocorrelation analysis, although you may want to use a
larger peak size for histone modifications (i.e. 500 or 1000) where the
minimum size of peaks observed are usually fairly large anyway.
The second parameter, "-minDist", is usually used to specify the minimum distance between adjacent peaks. If "-region" is used, this parameter then specifies the maximum distance between putative peaks that is allowed if they are to be stitched together to form a region. By default this is 2.5x the peak size. If you think about histone modifications, the signal is never continuous in enriched regions, with reduced signal due to non-unique sequences (that can't be mapped to) and nucleosome depleted regions. "-minDist" informs findPeaks how big of a gap in the signal will be tolerated for adjacent peaks to be considered part of the same region.
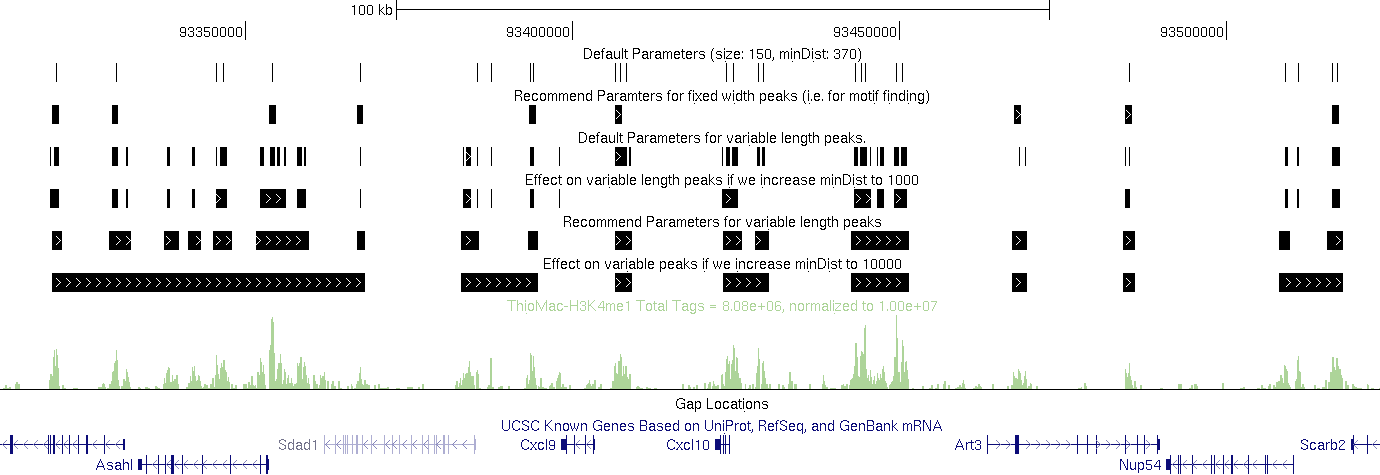
One thing to note is that you may have to play around with these parameters to get the results you want. If you look at the examples below, you could make arguments for using each of the tracks given what you're interested in and how you would define a "region".
For example: (in the example below, the default size comes from the autocorrelation estimate for the Macrophage-H3K4me1 dataset)
The second parameter, "-minDist", is usually used to specify the minimum distance between adjacent peaks. If "-region" is used, this parameter then specifies the maximum distance between putative peaks that is allowed if they are to be stitched together to form a region. By default this is 2.5x the peak size. If you think about histone modifications, the signal is never continuous in enriched regions, with reduced signal due to non-unique sequences (that can't be mapped to) and nucleosome depleted regions. "-minDist" informs findPeaks how big of a gap in the signal will be tolerated for adjacent peaks to be considered part of the same region.
One thing to note is that you may have to play around with these parameters to get the results you want. If you look at the examples below, you could make arguments for using each of the tracks given what you're interested in and how you would define a "region".
For example: (in the example below, the default size comes from the autocorrelation estimate for the Macrophage-H3K4me1 dataset)
Default Parameters:
findPeaks Macrophage-H3K4me1/ -i
Macrophage-IgG -size 150 -minDist 370 > output.txt (i.e. defaults)
Recommend Parameters for fixed width peaks (i.e. for motif finding):
findPeaks Macrophage-H3K4me1/ -i Macrophage-IgG -size 1000 -minDist 2500 > output.txt
Default Parameters for variable length peaks.
findPeaks Macrophage-H3K4me1/ -i Macrophage-IgG -region -size 150 -minDist 370 > output.txt
Recommend Parameters for fixed width peaks (i.e. for motif finding):
findPeaks Macrophage-H3K4me1/ -i Macrophage-IgG -size 1000 -minDist 2500 > output.txt
Default Parameters for variable length peaks.
findPeaks Macrophage-H3K4me1/ -i Macrophage-IgG -region -size 150 -minDist 370 > output.txt
Effect on variable length peaks
if we increase minDist to 1000.
findPeaks Macrophage-H3K4me1/ -i Macrophage-IgG -region -size 150 -minDist 1000 > output.txt
Recommend Parameters for variable length peaks (H3K4me1 at least).
findPeaks Macrophage-H3K4me1/ -i Macrophage-IgG -region -size 1000 -minDist 2500 > output.txt
Effect on variable peaks if we increase minDist to 10000 (H3K4me1 at least).
findPeaks Macrophage-H3K4me1/ -i Macrophage-IgG -region -size 1000 -minDist 10000 > output.txt
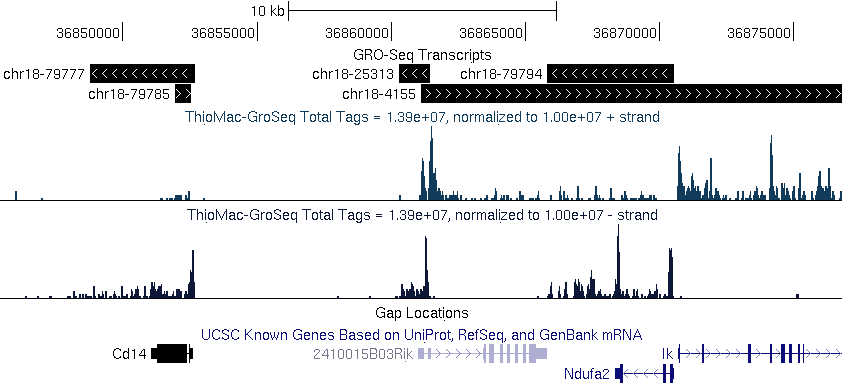
findPeaks
can also be used to define transcripts/exons from RNA-Seq and it's
variants. The only catch is that HOMER won't figure out the
splicing. However, for methods such as GRO-Seq (global nuclear
run-on sequencing) this can be useful for getting a sense for what the
transcripts are since we don't have to worry about introns in this type
of data. If you sequencing is strand specific, make sure to use "-strand specific". Also, it's
recommended to disable clonal filtering when analyzing RNA ("-C 0").
findPeaks GRO-Seq -strand
separate -size 200 -fragLength 100 -minDist 2000 -region -C 0 >
transcripts.txt
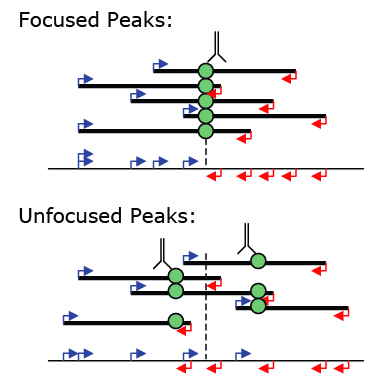
Peak Centering and Focus Ratios
If the option "-center" is specified, findPeaks will calculate the
position within the peak with the maximum ChIP-fragment overlap and
calculate a focusRatio for the
peak. This is not always desired (such as with histone
modifications). The focus ratio is defined as the ratio of tags
located 5' of the peak center on either strand relative to the total
number of tags in the peak. Peaks that contain tags in the ideal
positions are more likely to be centered on a single binding site, and
these peaks can be used to help determine what sequences are directly
bound by a transcription factor. Unfocused peaks, or peaks with
low (i.e <80%) focusRatios may be the result of several closely
spaced binding sites or large complexes that crosslink to multiple
positions along the DNA.
To isolate focused peaks, you can use the getFocalPeaks.pl tool:
To isolate focused peaks, you can use the getFocalPeaks.pl tool:
getFocalPeaks.pl <peak
file> <focus % threshold> > focalPeaksOutput.txt
i.e. getFocalPeaks.pl ERpeaks.txt 0.90 > ERfocalPeaks.txt
i.e. getFocalPeaks.pl ERpeaks.txt 0.90 > ERfocalPeaks.txt
Peak finding and Sequencing Saturation
HOMER does not try to estimate
sequencing saturation, which is the estimate of whether or not you have
sequenced enough tags to identify all the peaks in a given
experiment. Generally speaking, if you sequence more, you will
get more peaks since your sensitivity will increase. The only
real way to assess this is if you can somehow show that all of the
"functional" or "real" peaks have high tag counts (i.e. are well above
the threshold for identifying a peak), meaning that sequencing more is
not likely to identify more "real" peaks. This generally cannot
be determined by simply resampling the data and repeating the peak
finding procedure - you need some sort of outside information to
assess peak quality, such as motif enrichment or something else.
Simply resampling will likely only tell you if you've gotten to the
point where you are simply resequencing the same fragments again - i.e.
becoming clonal.
Command line options for findPeaks
Usage: findPeaks <tag directory> [options]Finds peaks in the provided tag directory. By default, peak list printed to stdout
General Options:
-o <output file> (default: stdout)
-i <input tag directory> (Experiment to use as IgG/Input/Control)
-size <#> (Peak size, default: auto)
-minDist <#> (minimum distance between peaks, default: peak size x2.5)
-gsize <#> (Set effective genome size, default: 2e9)
-fragLength <#|auto> (Approximate fragment length, default: auto)
-inputFragLength <#|auto> (Approximate fragment length of input tags, default: auto)
-tbp <#> (Maximum tags per bp to count, 0 = no limit, default: auto)
-inputtbp <#> (Maximum tags per bp to count in input, 0 = no limit, default: auto)
-strand <both|separate> (find peaks using tags on both strands or separate, default:both)
-norm # (Tag count to normalize to, default 10000000)
Peak localization/shape options:
-center (Centers peaks on maximum tag overlap and calculates focus ratios)
-region (extends start/stop coordinates to cover full region considered "enriched")
Peak Filtering options: (set -F/-L/-C to 0 to skip)
-F <#> (fold enrichment over input tag count, default: 4.0)
if set between 0 and 1, poisson p-value cutoff will be used, i.e. 0.001
-L <#> (fold enrichment over local tag count, default: 4.0)
if set between 0 and 1, poisson p-value cutoff will be used, i.e. 0.001
-C <#> (fold enrichment limit of expected unique tag positions, default: 2.0)
-localSize <#> (region to check for local tag enrichment, default: 10000)
-fdr <#> (False discovery rate, default = 0.001)
-poisson <#> (Set poisson p-value cutoff, default: uses fdr)
-tagThreshold <#> (Set # of tags to define a peak, default: uses fdr)
Links to alternative peak finding software
Lots of quality programs exist
for finding peaks in ChIP-Seq data. Most use slightly different
assumptions and peak definitions that result in slightly different sets
of peaks. Many of these programs output
peak files in BED format. To covert these to HOMER peak file
format, use the bed2pos.pl program to convert the file:
bed2pos.pl
peaks.bed > peaks.txt
Peak finding software links:
- MACS
(Liu Lab)
- ChIPSeq Peak Finder (Wold Lab)
- CCAT (Good for histone modifications)
- FindPeaks
- Probably hundreds of others: Google it!
Next: Finding Motifs in ChIP-Seq
Peaks

Can't figure something out? Questions, comments, concerns, or other feedback:
cbenner@ucsd.edu