
HOMER
Software for motif discovery and ChIP-Seq analysis
ChIP-Seq Analysis: Creating
Histograms from High-throughput Sequencing data and Motifs
HOMER can be used to make histograms that document ChIP-Seq library and
motif densities relative to specific positions in the genome.
This can be done near peaks, subsets of peaks, or near promoters, exon
junctions or anywhere else you find interesting. To make
histograms, use the annotatePeaks.pl
program but add the parameters "-hist
<#>" to produce a tab delimited text file that can then be
visualized using EXCEL or other data visualization software.Basic usage:
annotatePeaks.pl
<peak
file>
<genome>
-size
<#>
-hist
<#>
-d
<tag directory
1> [tag directory2] ... -m <motif 1> <motif 2> ...
> <output matrix file>
i.e. annotatePeaks.pl ERpeaks.txt hg18 -size 6000 -hist 25 -d MCF7-H3K4me1/ MCF7-H3K4me2/ MCF7-H3K4me3/ > outputfile.txt
i.e. annotatePeaks.pl ERpeaks.txt hg18 -size 6000 -hist 25 -d MCF7-H3K4me1/ MCF7-H3K4me2/ MCF7-H3K4me3/ > outputfile.txt
Running this command is very similar to creating annotated peak files - in fact, most of the data can be used to make both types of files - hence the reason for combining this functionality in the same command. Be default, HOMER normalizes the output histogram such that the resulting units are per bp per peak, on top of the standard total mapped tag normalization of 10 million tags.
Histograms of Tag Directories:
For each tag directory or motif,
HOMER will output 3 columns in the histogram. In the case of tag
directories, the first column will indicate ChIP-Fragment Coverage, which is
calculated by extending tags by their estimated ChIP-fragment length,
and is analogous to the profiles made for the UCSC Genome
Browser. The 2nd and 3rd columns report the density of 5' and 3'
aligned tags, and are independent of fragment length. For
example, lets look at H3K4me2 distribution near Androgen Receptor (AR)
peaks before and after 16 hours of treatment with testosterone (dht):
annotatePeaks.pl
ARpeaks.txt
hg18
-size
4000
-hist
10 -d H3K4me2-control/ H3K4me2-dht-16h/ >
outputfile.txt
Opening outputfile.txt with EXCEL, we see:
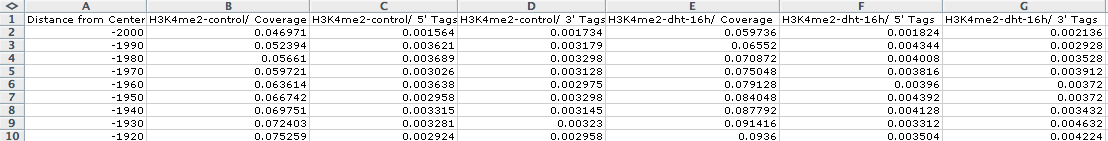
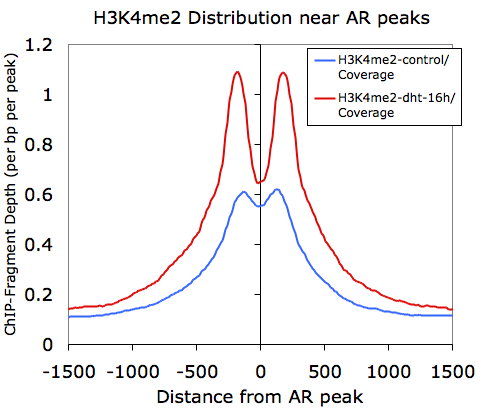
Graphing columns B and E while using column A for the x-coordinates, we get the following:
However, if we graph only the 5' and 3' tags that come from the H3K4me2-dht-16h directory (columns F and G):
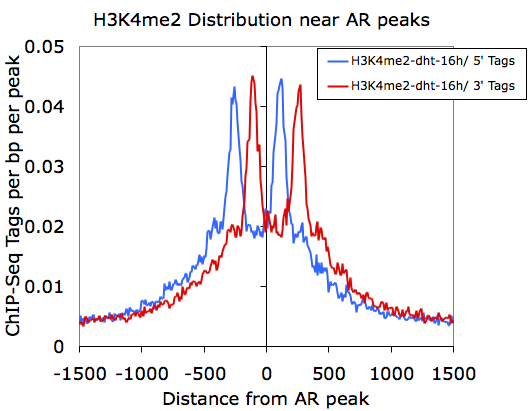
Here we can see how the 5' and 3' reads from the H3K4me2 marked nucleosomes are distributed near the AR sites.
Opening outputfile.txt with EXCEL, we see:
Graphing columns B and E while using column A for the x-coordinates, we get the following:
However, if we graph only the 5' and 3' tags that come from the H3K4me2-dht-16h directory (columns F and G):
Here we can see how the 5' and 3' reads from the H3K4me2 marked nucleosomes are distributed near the AR sites.
Histograms of Motif Densities:
Making histograms out of motif
occurrences is very similar to ChIP-Seq tag distributions. Run
the annotatePeaks.pl program with "-hist
<#>" and "-m <motif
file>" (you can also find motif densities and tag densities
at the same time):
Graphing outputfile.txt with EXCEL:
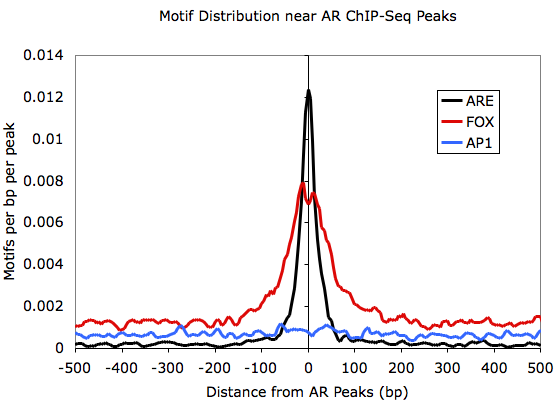
annotatePeaks.pl
ARpeaks.txt
hg18
-size
1000
-hist
5 -m are.motif fox.motif ap1.motif >
outputfile.txt
Graphing outputfile.txt with EXCEL:
Back to ChIP-Seq Analysis

Can't figure something out? Questions, comments, concerns, or other feedback:
cbenner@ucsd.edu