
HOMER
Software for motif discovery and ChIP-Seq analysis
ChIP-Seq Analysis: Creating Heatmaps
from High-throughput Sequencing data
HOMER is not capable of generating actual Heatmaps per se, but it will
generate the data matrix (similar to a gene expression matrix) than can
then be visualized using standard gene expression heatmap tools.
For example, I will generate a heatmap data matrix file using HOMER,
and then open it with Cluster
3.0
(Micheal
Eisen/de
Hoon) to cluster it and/or visualize it with Java Tree View (by Alok J.
Saldanha). In reality, you can use any clustering and/or
heatmap visualization software (i.e. R).Basic usage:
annotatePeaks.pl
<peak
file>
<genome>
-size
<#>
-hist
<#> -ghist
-d <tag directory
1> [tag directory2] ... > <output matrix file>
i.e. annotatePeaks.pl ARpeaks.txt hg18 -size 6000 -hist 25 -ghist -d H3K4me2-control/ H3K4me2-dht-16h/ > outputfile.txt
i.e. annotatePeaks.pl ARpeaks.txt hg18 -size 6000 -hist 25 -ghist -d H3K4me2-control/ H3K4me2-dht-16h/ > outputfile.txt
Running this command is very similar to making histograms with annotatePeaks.pl. In fact, a heatmap isn't really all that different from a histogram - basically, instead of averaging all of the data from each peak, we keep data from each peak separate and visualize it all together in a heatmap. The key difference when making a heat map or a histogram is that you must add "-ghist" when making a heatmap.
Format of Data Matrix Output File
The resulting file is a
tab-delimited text file where the first row is a header file and the
remaining rows represent each peak from the input peak file. The
first set of columns will describe the ChIP-fragment densities from the
first tag directory as a
function of distance from the center of the peak, with bin sizes
corresponding to the parameter used with "-hist <#>". After the
first block of columns, a second block will start over with
ChIP-Fragment densities from the 2nd
tag directory, and so on. If you would like to cluster
this file to help organize the ChIP-Fragment distribution patterns,
make sure you only cluster the "genes" (i.e. rows).
Creating the Heatmap:
If
we
run
the
command above, we have a file named outputfile.txt that
contains the "heatmap matrix". Opening that file with Cluster
3.0, and clustering the genes with hierarchical clustering using
average linkage, we end up with files outputfile.gtr and
outputfile.cdt. Due to the scaling of hierarchical clustering
(N^2), it's best to keep the number of peaks relatively small (<5k)
to avoid clustering all night. After the clustering is complete,
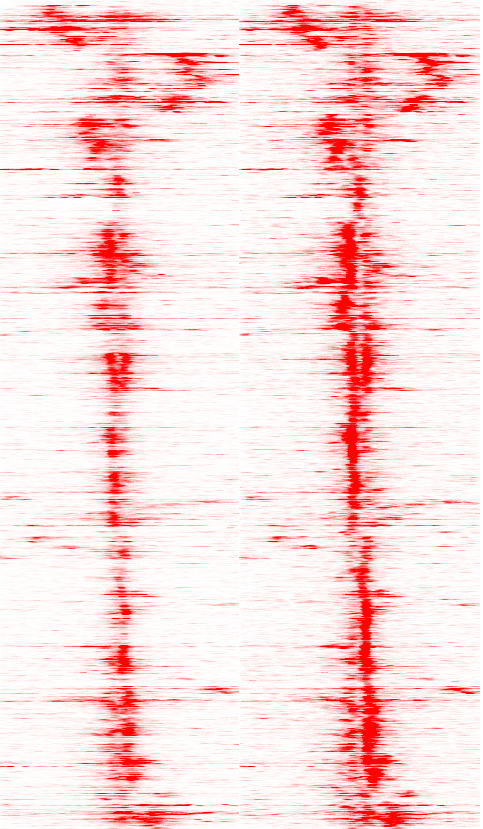
use Java Tree View to open the *.cdt file. You'll like need to
scale the pixels and adjust the colors to clearly see the whole
picture. For example, this is what I get (H3K4me2-control on the
left, H3K4me2-dht-16h on the right):
Back to ChIP-Seq Analysis

Can't figure something out? Questions, comments, concerns, or other feedback:
cbenner@ucsd.edu